Getting Ready - Setting Up Instrumentation
Over the last six months, I have been working on improving the performance of React Native. I specifically focussed on the startup time in Android brownfield apps and we were able to reduce the time by half. Even as we wait for the new UI architecture (Fabric) and synchronous native modules (TurboModules) to rein in significant performance wins, there are many low hanging fruits that could be leveraged today to improve performance
In this series of blog posts, I wanted to outline some of the work we did and how they could apply to your mobile apps.
Background
When working on performance, it is easier to focus on a well defined scenario, and then apply the lessons in a broader context. Android startup time in React Native apps is a common source of pain and makes for a good candidate for this blog post. To define it more specifically- The scenario starts with the onCreate of the application.Though there is a is non-trivial amount of work done from when the user clicks the icon to the onCreate, it is not React Native specific. General Android optimizations will help.
- The scenario ends when the application loads and the user can interact with it. This metric, also called Time-To-Interaction (TTI), is app specific and needs to be defined in the application code, as explained later.
We will look at collecting data from production as it better represents the behavior of the app in the real world. We can always augment this with local profiling tools that are available to React Native apps.on local builds.
From React Native
React Native already has markers indicating the various steps during the startup process. By adding listeners to the events from ReactMarker, we can report back all the information that the framework gives us during startup.- Copy the contents of the file PerfLogger.java to your app's <app_root>/android/app/src/main/java/com/nparashuram/PerfLogger.java. This file adds a listener to ReactMarker, and stores the performance events with Thread IDs and time stamps.
- In your application's MainApplication.java, look for the onCreate method, and initialize the PerfLogger just after the super.onCreate(); line using this - new PerfLogger(getReactNativeHost()).initialize();
Defining end of TTI
Now that we have started collecting the performance markers, we also need to define when to stop recording. For this blog post, we defined the "end of startup" to be when content is rendered on the screen and the user can interact with it.This is usually application specific. Some applications would immediately render content while others may have to show a loading screen, perform a network request and then display the response. In either case, you can distill "loading-complete" down to the appearance of a specific React component on the screen.
Add a prop nativeID="tti_complete" to that element. For example, if we are displaying a feed, the last View on the feed could be <View nativeID="tti_complete">.
The PerfLogger java code waits for the native UI element with the nativeID to be drawn, and then makes all performance data available to your JavaScript code.
The JavaScript code
On the JavaScript side, include perf.js in your application code. When PerfLogger.java sees that TTI is complete, it populates a global JS variable with all the data, which can then be sent to a server.A significant portion of startup also includes the execution of JS code. You could use the ComponentLogger defined in perf.js to mark the start and stop of mounting components. We would typically start with large sections on the UI, and add wrap more components as we want to get more fine grained data. Since this is also pure JS code, you could experiment with various combinations and iterate fast using over the air updates like code push.
This component simply wraps your component and stores timestamps for them.
The perf.js file also converts this data to a format that can be loaded in chrome://tracing and sends it to a server after a timeout. In the real world, the data should be sent in the same way any other analytics information is sent.
Analyzing the data
Once we start getting data from production, we can start looking at data from individual traces. Note that using averages here may not help since averages of the ranges do not add up. Instead, we could pick a trace that represents a certain percentile. For example, if our goal is to make our app load in under 1 second for the 75th percentile, we could pick the trace representing P75.The tracing file can be loaded in chrome://tracing to drill deeper into individual sections. For this post, I looked at the MatterMost app, and here is how a sample trace may look.
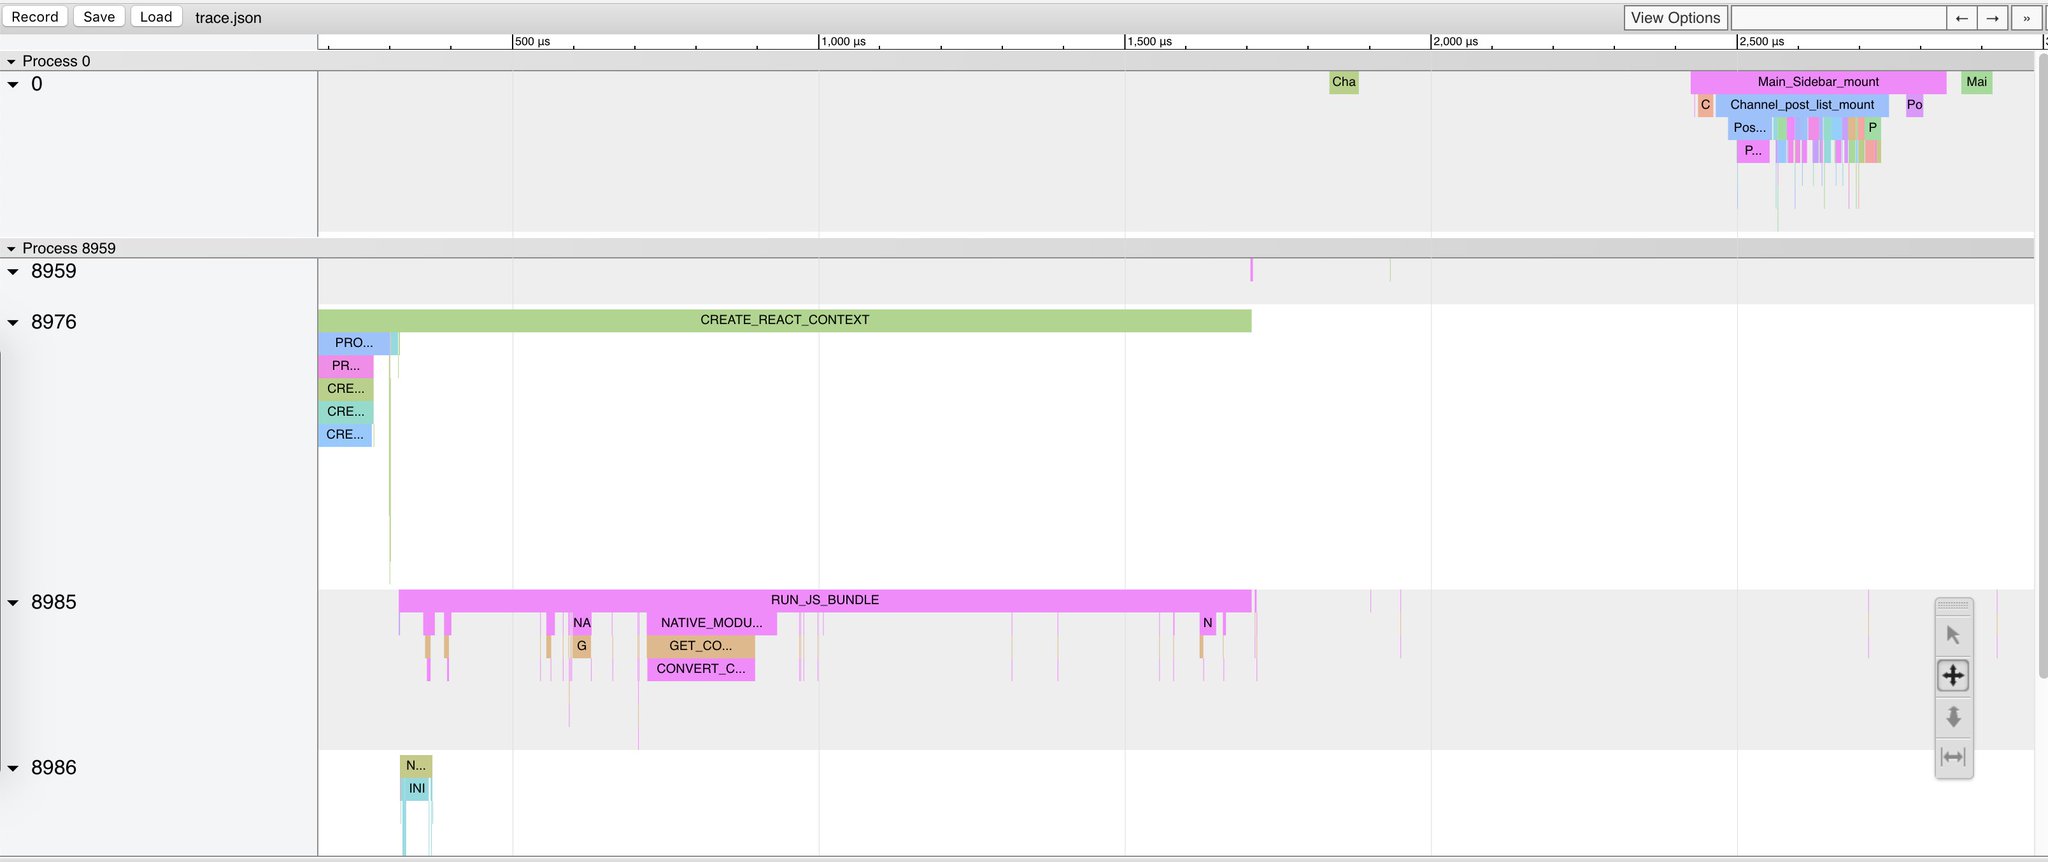
Since we also collect thread information, we can see the four threads on which React Native runs. To differentiate React Native code from application logic, I just made that a separate Process 0 at the very top. Note how we record both the loading screen, and the actual content that is rendered, before marking TTI complete.