Cross post from calendar.perfplanet.com
Ten years ago, increasing the performance of a website usually meant tweaking the server side code to spit out responses faster. Web Performance engineering has come a long way since then. We have discovered patterns and practices that make the (perceived) performance of websites faster for users just by changing the way the front end code is structured, or tweaking the order of elements on a HTML page. Majority of the experiments and knowledge has been around delivering content to the user as fast as possible.
Today, web sites have grown to become complex applications that offer the same fidelity as applications installed on computers. Thus, consumers have also started to compare the user experience of native apps to the web applications. Providing a rich and fluid experience as users navigate web applications has started to play a major role in the success of the web.
Most modern browsers have excellent tools that help measure the runtime performance of websites. The Chrome Devtools features a powerful Timeline panel that gives us the tracing information needed to diagnose performance problems while interacting with a website. Metrics like frame rates, paint and layout times present an aggregated state of the website’s runtime performance from these logs.
In this article, we will explore ways to collect and analyze some of those metrics using scripts. Automating this process can also help us integrate these metrics into the dashboards that we use to monitor the general health of our web properties. The process usually consists of two phases – getting the tracing information, and analyzing it to get the metrics we are interested in.
Collecting Tracing information
The first step to get the metrics would be to collect the performance trace from chrome while interacting with the website.Manually recording a trace
The simplest way to record a trace would be to hit the “start recording” button in the timeline panel, performing interactions like scrolling the page or clicking buttons, and then finally hitting “stop recording”. Chrome process all this information and shows graphs with framerates. All this information can also be saved as a JSON file by right-clicking (or Alt-clicking) on the graph and selecting the option to save the timeline.Using Selenium
While the above method is the most common way to collect tracing from Chrome, doing these repeatedly over multiple deployments or for different scenarios can be cumbersome. Selenium is a popular tool that allows us to write scripts that perform interactions like navigating webpages or clicking buttons and we could leverage such scripts to capture trace information.To start performance logging, we just need to ensure that certain parameters are added to the existing set of capabilities.
Selenium scripts have binding for multiple programming languages and if you already have selenium tests, you could add the capabilities in the following examples to also get performance logs. Since we are only testing Chrome, running just Chromedriver instead of setting up Selenium and then executing the following node script gets the trace logs.
var wd = require('wd');
var b = wd.promiseRemote('http://localhost:9515');

b.init({
    browserName: "chrome",
    chromeOptions: {
        perfLoggingPrefs: {
            "traceCategories": "toplevel,disabled-by-default-devtools.timeline.frame,blink.console,disabled-by-default-devtools.timeline,benchmark"
        },
        args: ["--enable-gpu-benchmarking", "--enable-thread-composting"]
    },
    loggingPrefs: {
        performance: "ALL"
    }
}).then(function() {
    return b.get('http://calendar.perfplanet.com'); // Fetch the URL that you want
}).then(function() {
    // We only want to measure interaction, so getting a log once here
    // Flushes any pervious tracing logs we have
    return b.log('performance');
}).then(function() {
    // Perform custom actions like clicking buttons, etc
    return b.execute('chrome.gpuBenchmarking.smoothScrollBy(2000, function(){})');
}).then(function() {
    // Wait for the above action to complete. Ideally this should not be an arbitraty timeout but be a flag
    return b.sleep(5000);
}).then(function() {
    // Get all the trace logs since last time log('performance') was called
    return b.log('performance');
}).then(function(data) {
    // This data is the trace.json
    return require('fs').writeFileSync('trace.json', JSON.stringify(data.map(function(s) {
        return JSON.parse(s.message); // This is needed since Selenium spits out logs as strings
    })));
}).fin(function() {
    return b.quit();
}).done();
The script above tells selenium to start chrome with performance logs, and enables specific trace event categories. The “devtools.timeline” category is the one used by Chrome devtools for displaying its graphs about Paints, Layouts, etc. The flags “enable-gpu-benchmarking” expose a
window.chrome.gpuBenchmarking object that has a method to smoothly scroll the page. Note that the scroll can be replaced by other selenium commands like clicking buttons, typing text, etc. Using WebPageTest
WebPageTest also roughly relies on the performance log to display metrics like SpeedIndex. As shown in the image, the option to capture the timeline and trace json files has to be enabled.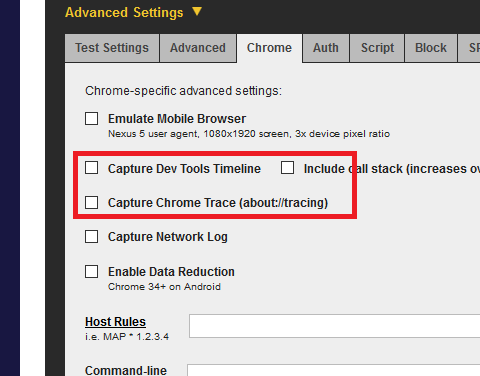
Custom actions can also be added to perform actions in a WebPageTest run scenario. Once WebPageTest run finishes, you can click download the trace files by clicking the appropriate links. This method could not only be used in WebPageTest, but also with tools like SpeedCurve that support custom metrics.
Analyzing the Trace Information
The trace file that we get using any of the above methods can be loaded in Chrome to view the page’s runtime performance. The trace event format defines that each record should contain a cat (category), a pid (processId), a name and other parameters that are specific to an event type. These records can be analyzed to arrive at individual metrics. Note that the data obtained using the Selenium Script above has some additional metadata for every record that may need to be scrubbed before it can be loaded in Chrome.Framerates
To calculate the FrameRates, we could look at events by the nameDrawFrame.
This indicates that a frame was drawn on the screen and by calcuating
the number of frames drawn, divided by the time for the test, we could
arrive at the average time per frame. Since we also have benchmarking category enabled, we could look “BenchmarkInstrumentation:*” events that have timestamps associated with them. Chrome’s telemetry benchmarking system uses this data to calculate the average frame rates. Paints, Styles, Layouts and other events
The events corresponding toParseAuthorStyleSheet, UpdateLayoutTree and RecalculateStyles are usually attributed to the time spent in Styles. Similarly, the log also contains Paint and Layout events that could be useful. Javascript time can also be calculated using events like FunctionCall or EvaluateScript. We can also add the GC events to this list. Network Metrics
The tracelogs also have information related to firstPaint etc. However, the ResourceTiming API and the NavigationTiming APIs make this information available on the web page anyway. It may be more accurate to collect these metrics directly from real user deployments using tools like Boomerang, or from WebPageTest.Considerations
There are a few things to consider while running the tests using the methods mentioned above.Getting Consistent metrics
Chrome is very smart at trying to draw the page as fast as possible and as a result, you could see variations in the trace logs that are gathered when running tests for a scenario twice. When recording the traces manually, human interaction may introduce differences in the way a mouse is moved or a button is clicked. Even when automating, running separate selenium scripts occurs over the network and executing these scripts is also recorded in the logs.To get consistent results, all this noise needs to be reduced. It would be prudent to not combine scenarios when recording trace runs. Additionally, running all automation scripts as a single unit would also reduce any noise. Finally, comparing tests runs across multiple deploys is even better since both these runs would have the same test script overhead.
Trace file size
The trace file can take up a lot of space and could also fill up Chrome’s memory. Requesting for the logs from ChromeDriver could in a single, buffered request could also result in Node throwing out of memory exceptions. The recommendation here would be to use libraries like JSONStream to parse the records as a stream. Since we are only interested in aggregating the individual records, streaming can help consume scenarios that are longer and hence take more memory.Browser Support
The performance logs are available on the recent versions of the Chrome browser, both on the desktop and on Android. I had worked on a commit to make similar trace logs available for mobile Safari. Hybrid applications using Apache Cordova use WebViews which are based on browsers. Hence, this method could also be applied to Apache Cordova apps for Android and iOS.Note that these performance logs started as being Webkit specific, and hence are not readily available for Firefox or IE yet.
Conclusion
All the techniques described above are packaged together in the browser-perf package. Browser-perf only adds the extra logic to smooth out the edge cases like the scrolling timeout, or ability to pick up specific metrics, or processing the trace file as a stream. I invite you to check out the source code of browser-perf to understand these optimizations.These metrics can be piped into performance dashboards and watching out for these metrics should give us an idea of general trends of how the web site has been working across multiple commits. This could be one small step to ensure that websites continue to deliver a smooth user experience.